


It looks like John Hattie’s words of wisdom may well have been said in vain. Implementation of the New Zealand National Standards for primary and intermediate school pupils starts today.
School boards and principals are not convinced that there is much to be gained by applying the standards. They have numerous reasons for their beliefs. Many school boards are planning to boycott their use, which would be illegal.
Nevertheless, government approval has been given for the campaign to persuade communities and school boards of the usefulness of the standards, at an estimated cost of $26,000,000NZ.
The pros and cons
I listen to the arguments that abound in the national news, buzzing with the debate between the parties in favour of using standards and those against. Some politicians who were originally in favour of the standards are now arguing against them. I’m amused at what I hear.
Here’s an example. There is argument of dismay expressed about the 25% of children in New Zealand who are well below average in literacy abilities, an average which was no doubt considered when setting the literacy standards in the first place. The argument is that the introduction of standards will help those in that well-below-average group.
I wonder if some of the contributors to that argument can understand what a distribution is, and the significance of an average based on that same distribution. Misguided use of statistics, even by authorities, is not unknown in disciplines other than education.
People statistics
In the late eighties, the Plunket movement was very enthusiastic, as it is today. Mothers with newborn children can choose to be visited by a Plunket nurse who administers advice when needed and who makes regular checks to record the development of children under their care.
I knew a young family back then. Murray and Pauline who is a nurse, had a beautiful bouncing baby daughter. Both Pauline and her husband were petite people of delicate build and stature. At birth, Elizabeth was a small baby. The presiding doctors agreed she was normal for her birth weight. She was a healthy child who developed well in all respects.
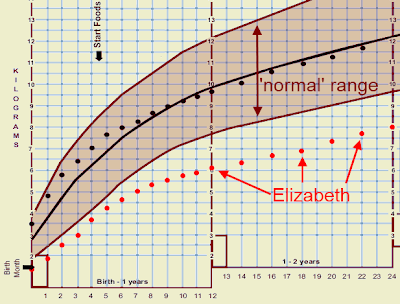
One day I walked round to see the family only to find Pauline quite upset. She’d just had a visit from the Plunket nurse who’d said that Elizabeth was well below average in both size and weight. Pauline had been told that she should ensure Elizabeth was given the food required to lift her weight into the ‘normal’ range.
Pauline felt insulted and annoyed. Her reasoning was implicit. A petite newborn from parents of small stature would be expected to grow into a petite child, and subsequently mature to a petite adult. Over the years we found that was exactly what happened.
Furthermore, Elizabeth’s potential to maintain this has been with her since birth. It comes down to the difference between body size and body development. These measurable quantities are not the same.
The Plunket movement in New Zealand do a deal of good work in monitoring and caring for the health and welfare of the very young from birth. But the interpretation of the growth chart by the nurse indicated that Elizabeth’s data was being clearly misunderstood.
Academic parallel
There is a parallel in the academic progress of children who are developing normally. That’s not to say that a child who is below what’s considered ‘average’ at an early age won’t continue to develop to have useful and perhaps even above average abilities in the future.
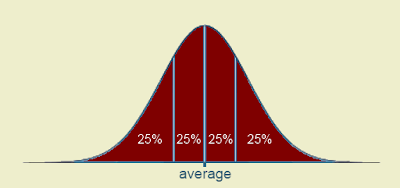
But there is always going to be 25% of children who are well below average in literacy ability. Any standard based on what is expected of an ‘average’ child will indicate this when applied to a fair and random sampling from a nation’s children.
I applaud the arguments that are saying let’s improve the nation’s academic achievement through good teaching. Forget about assessment of the child at early stages as a comparison with what’s considered ‘average’. Let’s look towards progress and development in the child.
My hunch is that the introduction of standards will not bring about an understanding of what is good to look for in child development in literacy, numeracy or any other ability. Instead, it is likely to serve as a measuring stick for a whole range of things unrelated to child development.


3 comments:
An excellent point and perspective! Of course in any bell curve there has to be someone in the lower scale.
After 10 years of NCLB standards in the US, this is something that people still don't get. If you have a school with 25% learning disabilities and these are not exempt from the general population standards, then you will always have 25% who aren't meeting "standards". I'd like to know when "standards" became the statistical average.
I wrote about the new "standards" in math that were demanded when there was a high percentage of the school population that met the standards. Rather than maintaining the standards, the commissioner called for higher standards because too many students were passing! So these are not standards, but rather a way of dividing the society up into those that are "smart" and those that "aren't smart."
Kia ora e Shaun!
I general, you're right, of course, though I am aware that not every distribution delivers a perfect 'bell curve'.
Tēnā koe Virginia!
It is much the same with moderation of NCEA standards in New Zealand. Though the standard may clearly set the standard, the assessment schedules are moderated according to the assessment distributions that result. This skews the whole purpose for setting a standard in the first place, of course, making a mockery of any standard per se.
Catchya later
Post a Comment